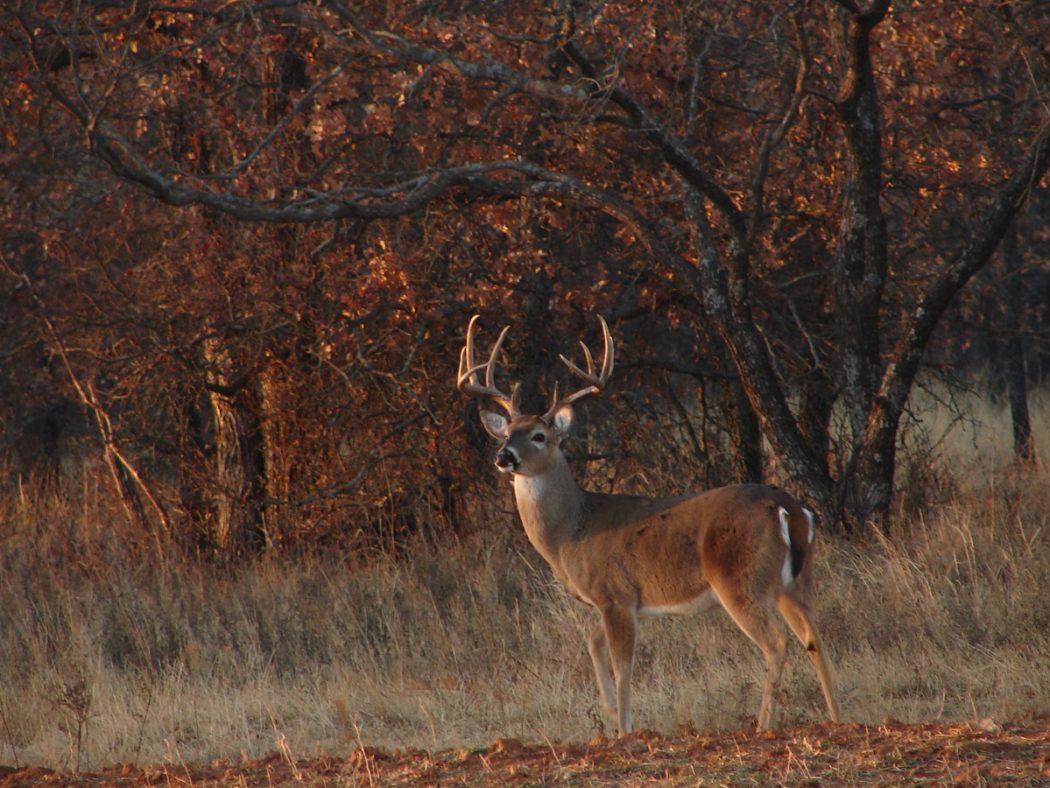
There are always questions about Whitetail Deer that usually include two very popular ones like “What state has the most trophy bucks?” or this one that is really getting popular “Where have all the deer gone?”. The later question seems to be the important one these days in a lot of states in the Midwest.

With the outbreak of diseases like EHD (Epizootic Hemorrhagic Disease), Bluetongue Disease, CWD (Chronic wasting disease) and new ones that seem to be popping up that the governments can’t (won’t) explain, our deer populations really seem to be taking a hit. With all of this going on, its hard to tell where the effects are really hitting the hardest. That is where programs like Boone & Crockett Club and Pope & Young Club do a great service to help track harvest. No these clubs are not just a place to show off your trophy, they are about conservation first and foremost. “The Boone and Crockett Club is a non-profit organization dedicated to hunter and conservation ethics, education, and demonstration.” Boone & Crockett and Pope & Young are there to help and because of them, we have a more abundance of wildlife. You can also learn about the white tailed deer
So where are all the deer these days? I wanted to see how all the states looked since the year 2000 as far as Whitetail Deer numbers. I know these numbers are only trophy bucks that have been turned into the records, but it’s still a good example of how the overall numbers are per state. I also wanted to track how some states that never used to be known for producing big Whitetail Bucks are starting to over the last few years due to better conservation practices and other programs like QDMA. Thanks to Trophy Search from Boone & Crockett, I was able to really search in detail and categorize just about everything I wanted to research where the deer are.
While looking through these lists, notice the patterns. You will see how some states are climbing the charts while others stay the same or start to drop. There are also some states that only have good numbers of typical deer compared to non-typical. But the real number that stands out is the average and how it’s really not changing much. Not yet anyway. These numbers don’t show anything entered in 2013. I measure for these records programs and I can tell you this, the 2013 and 2014 numbers will show a big drop.
Take a look at all the data below and let me know how they compare to what you are seeing in your state. Are you in one of those that are climbing the charts? If so, why is it happening? What about states that are dropping in numbers? What’s the reason for that?

You can see the top entries for Typical Whitetail, Non-Typical Whitetail and total number of Boone & Crockett Whitetails recorded into the record book during the span of years. Not much changing except for some lesser known states creeping up the list . These numbers are for all Record Book Whitetail starting in the Awards category. For a Typical Whitetail, the Awards Category starts at 160″ and for Non-Typical it starts at 185″. All Time Record book is 170″ for Typical and 195″ for Non-Typical

Below are the top counties that have been entered into the Boone & Crockett Record Book.

And finally who is producing then and now.


